Audit and Reporting
Using Cost Dashboard
Using Cost Dashboard is a vital feature within the Audit and Reporting framework, providing users with a centralized, visual representation of cloud resource consumption and associated costs. This dashboard is designed to help organizations track spending, monitor trends, and make informed decisions to optimize budget usage. Typically, the dashboard displays key metrics such as total spend over time, costs by service or project, usage patterns, and budget vs. actual comparisons. Using Cost Dashboard transforms raw billing data into actionable insights, facilitating transparency, cost control, and strategic planning across the organization.
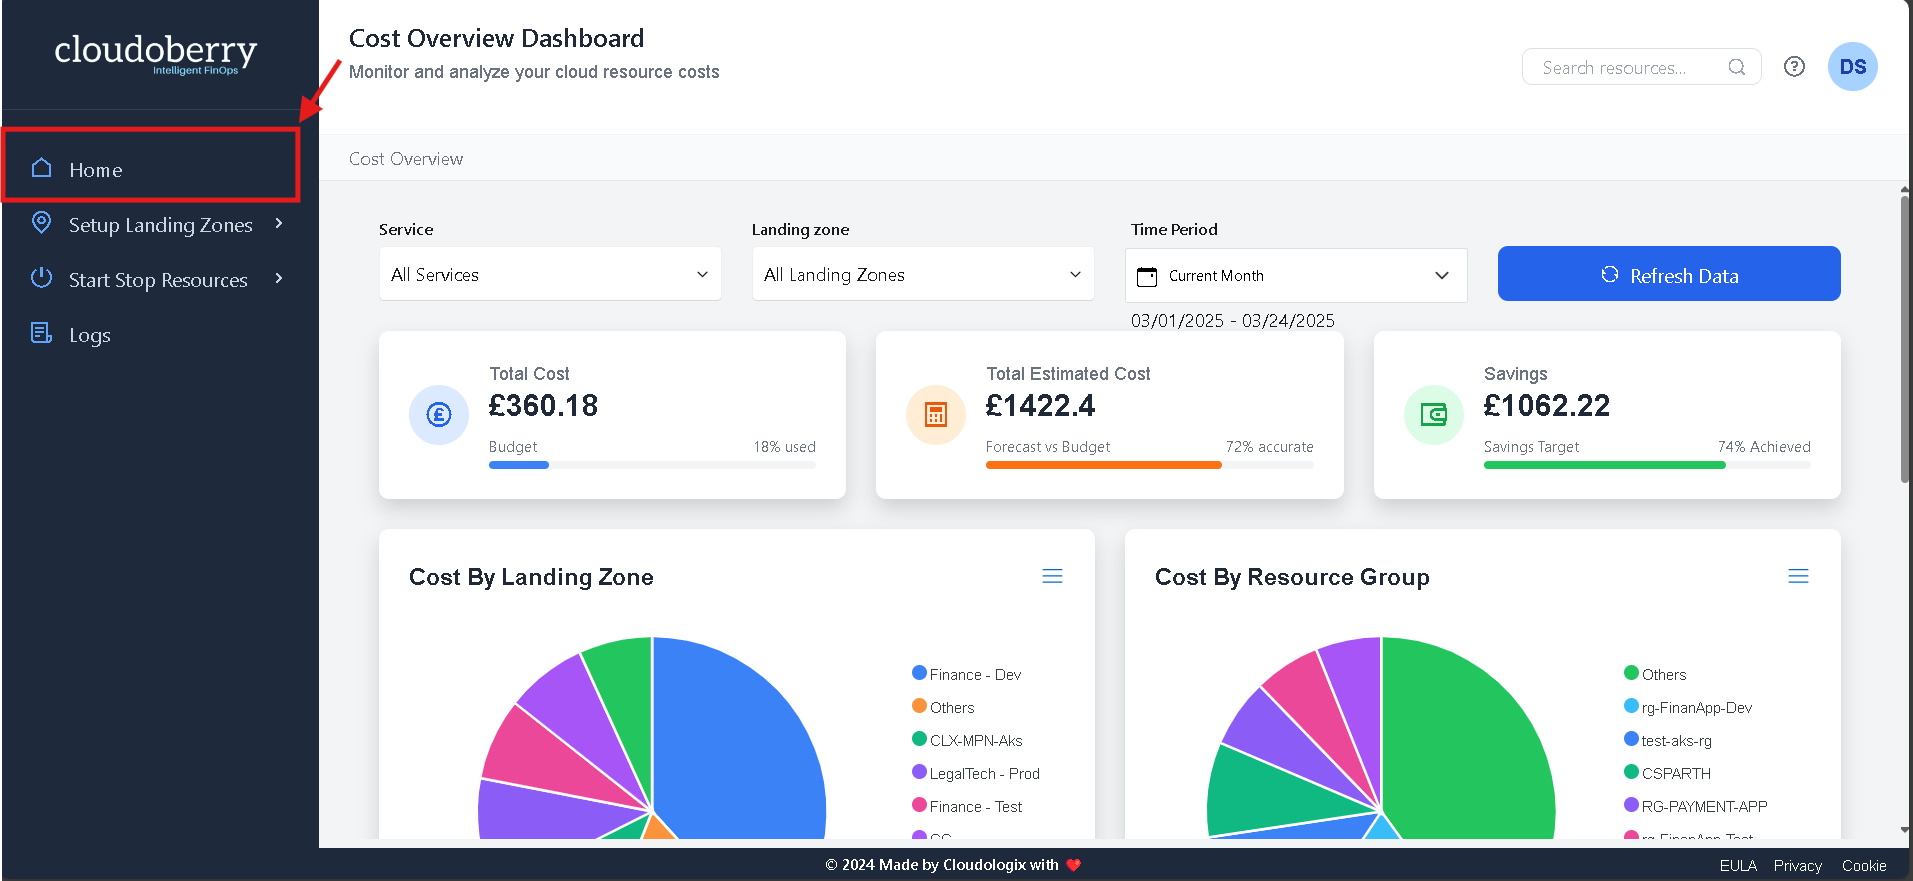
Access Dashboard:
Navigate to the Home Page to monitor and analyse cloud resource costs efficiently.
Key Features:
Filter Cost Reports based on specific resources, landing zones, applications, or time periods to analyse expenses effectively.
Refresh Data to get the latest updates on cost insights.
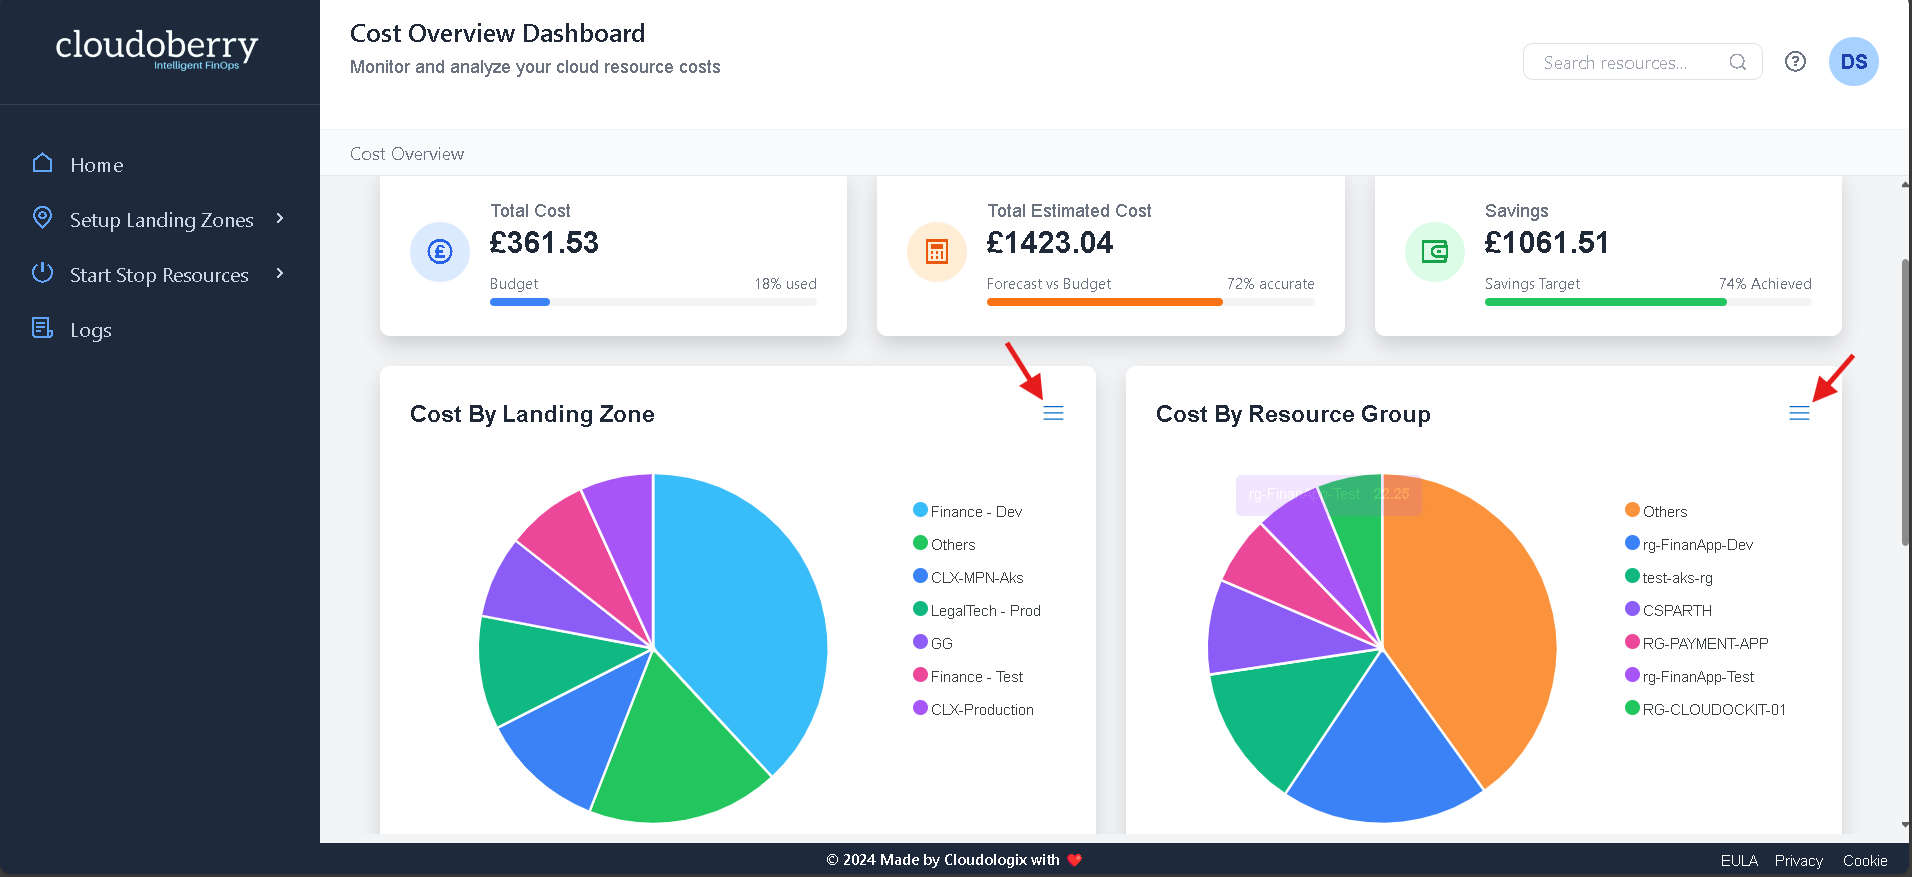
Cost Metrics:
Total Cost – The actual cost incurred after using Cloudoberry.
Total Estimated Cost – The projected cost based on expected resource usage.
Savings – The difference between the Total Estimated Cost and Total Cost, reflecting cost optimizations.
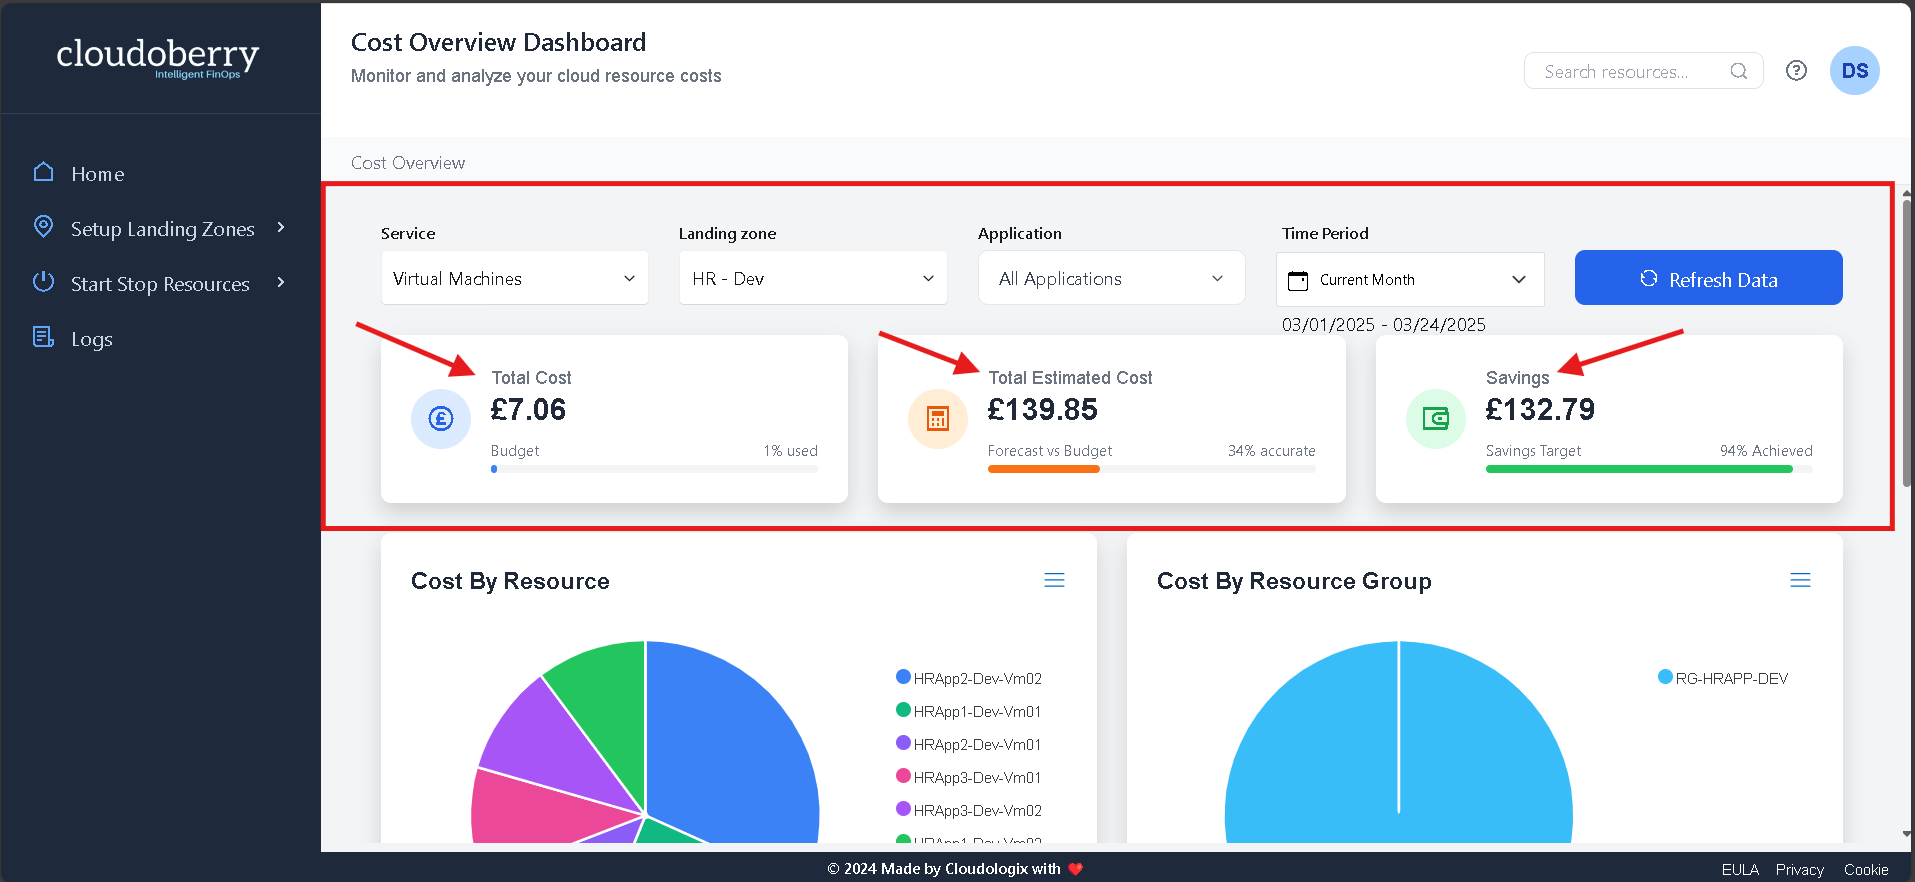
Additionally, it provides:
Budget Utilization Percentage – Tracks how much of the allocated budget has been used.
Prediction Accuracy – Measures how closely the estimated cost aligns with actual spending.
Savings Achievement – Indicates progress toward the targeted cost saving.
View Metrics:
Explore various cost metrics, trends, and visualizations.
Hover over the color corresponding to a specific landing zone or resource group to view cost details. For example, hovering over the cyan section displays the Total Cost for the Finance-Dev Landing Zone, which is £137.8 till now.
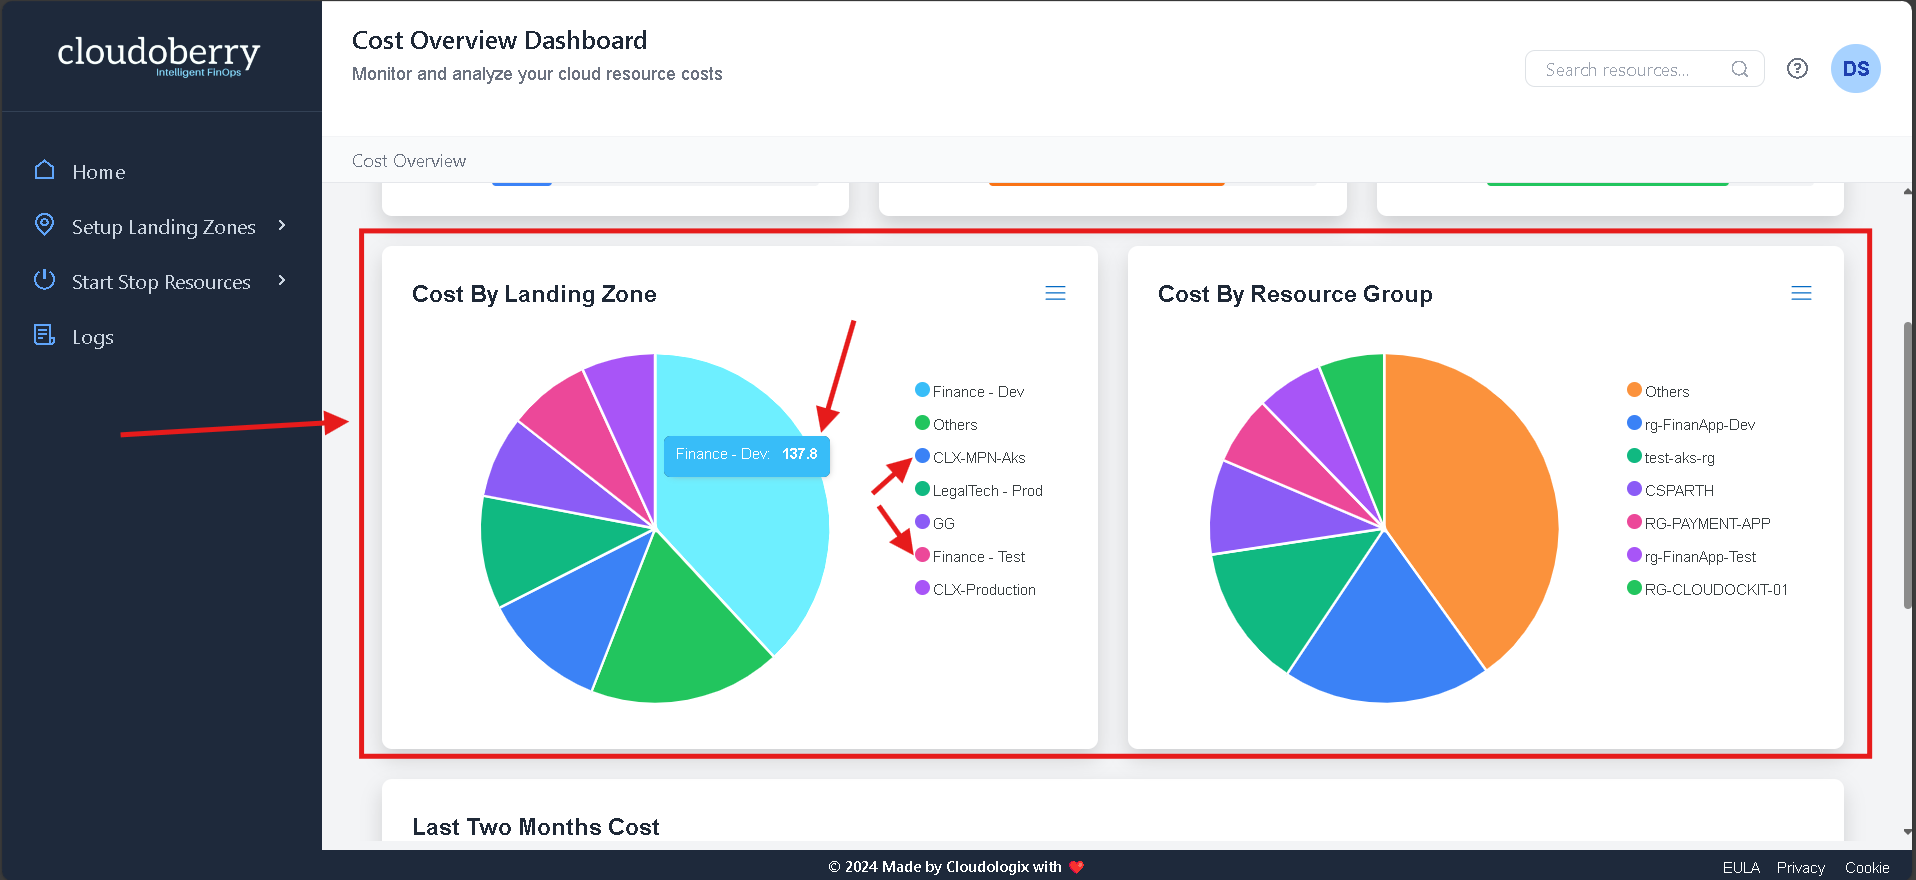
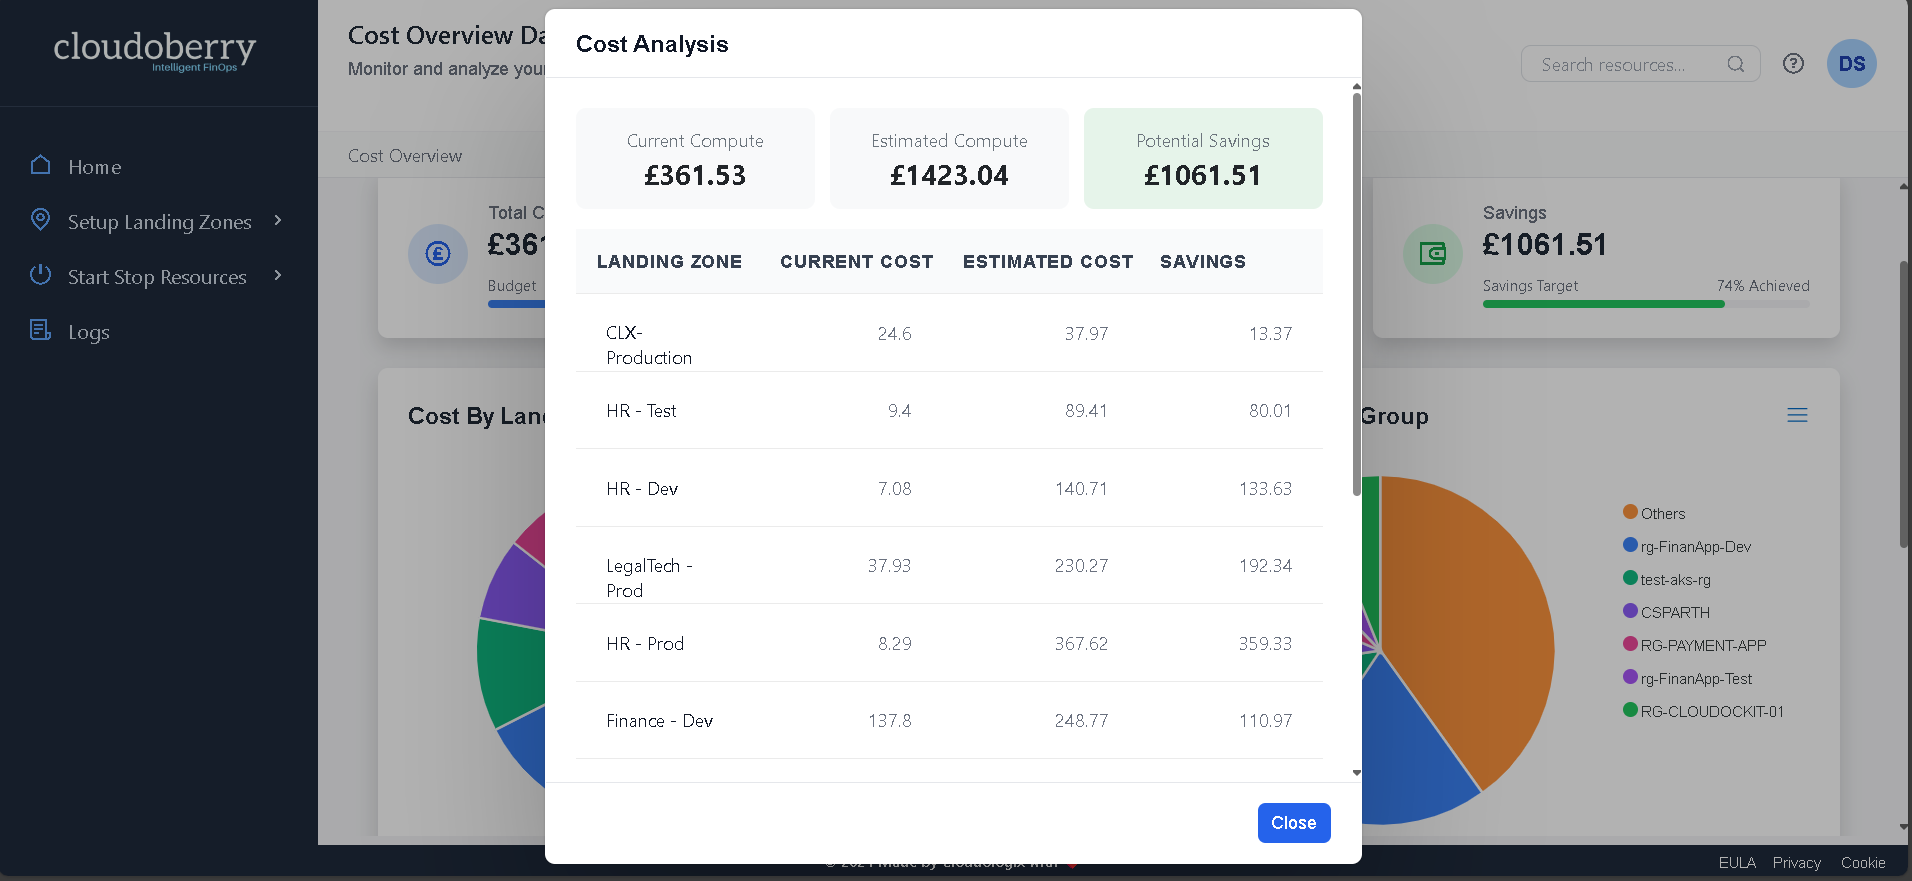
Hover over the Hamburger Menu Icon to view a detailed cost breakdown for all landing zones or resource groups in a structured tabular format. This allows for a comprehensive cost analysis across different environments.
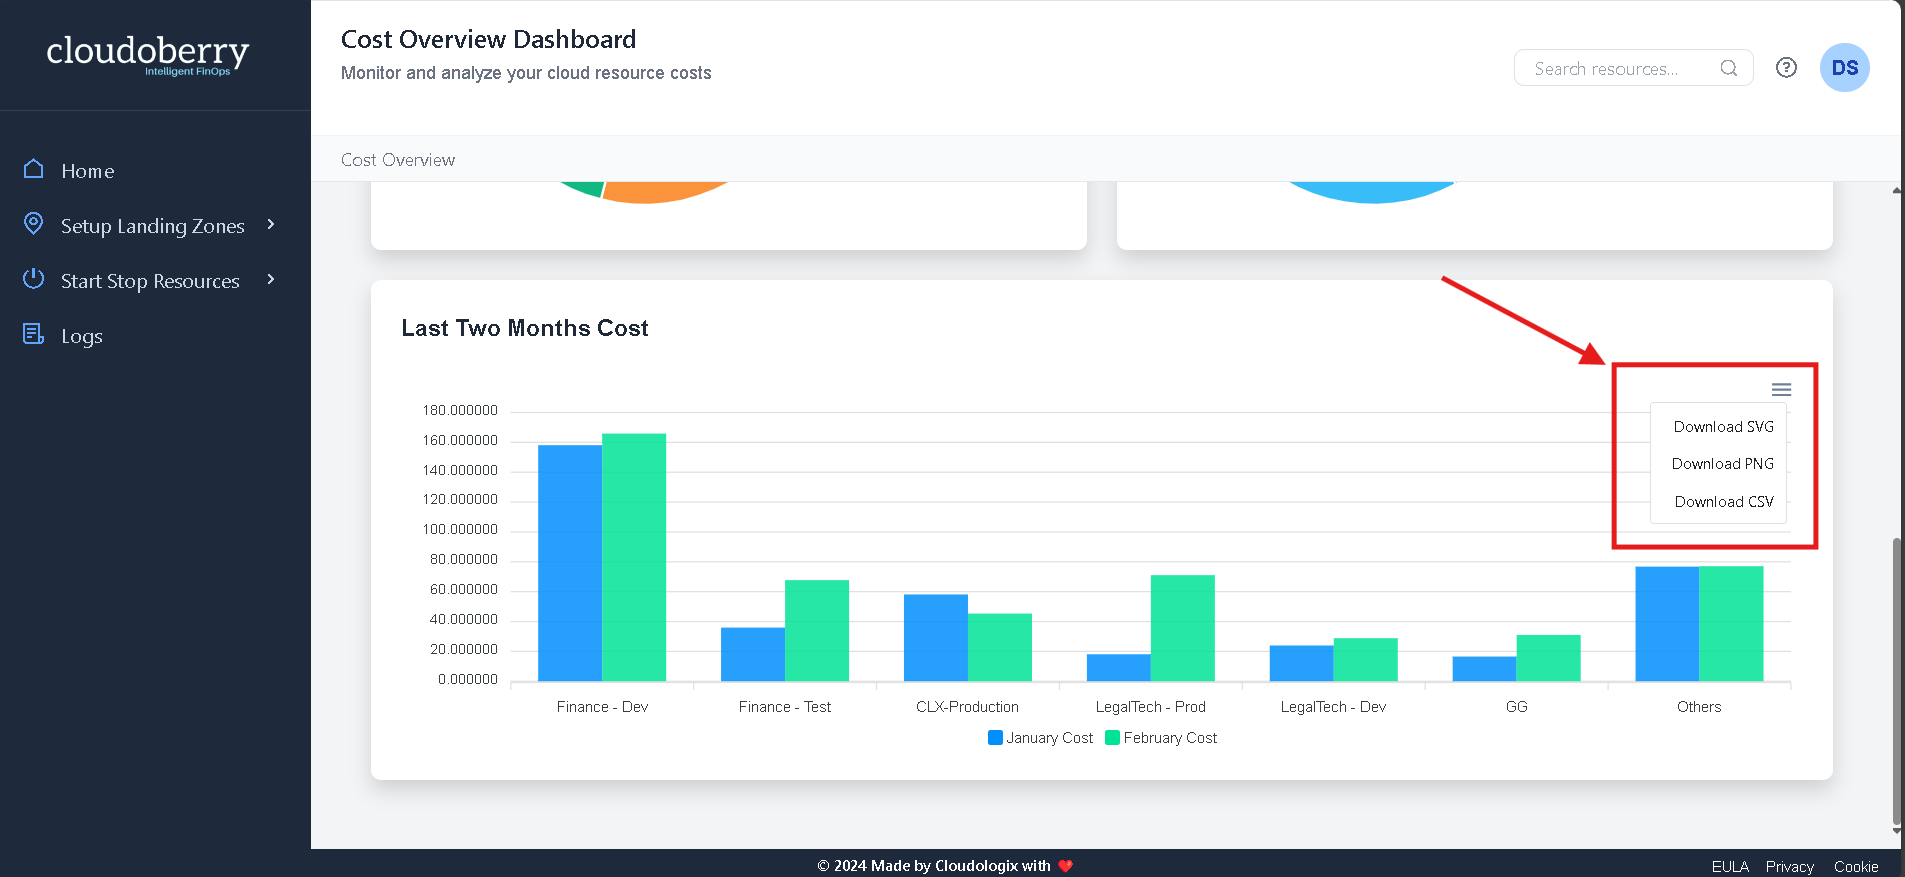
View the Last 2 Months' Costs in a bar graph format, providing a visual comparison of expenses across different landing zones.
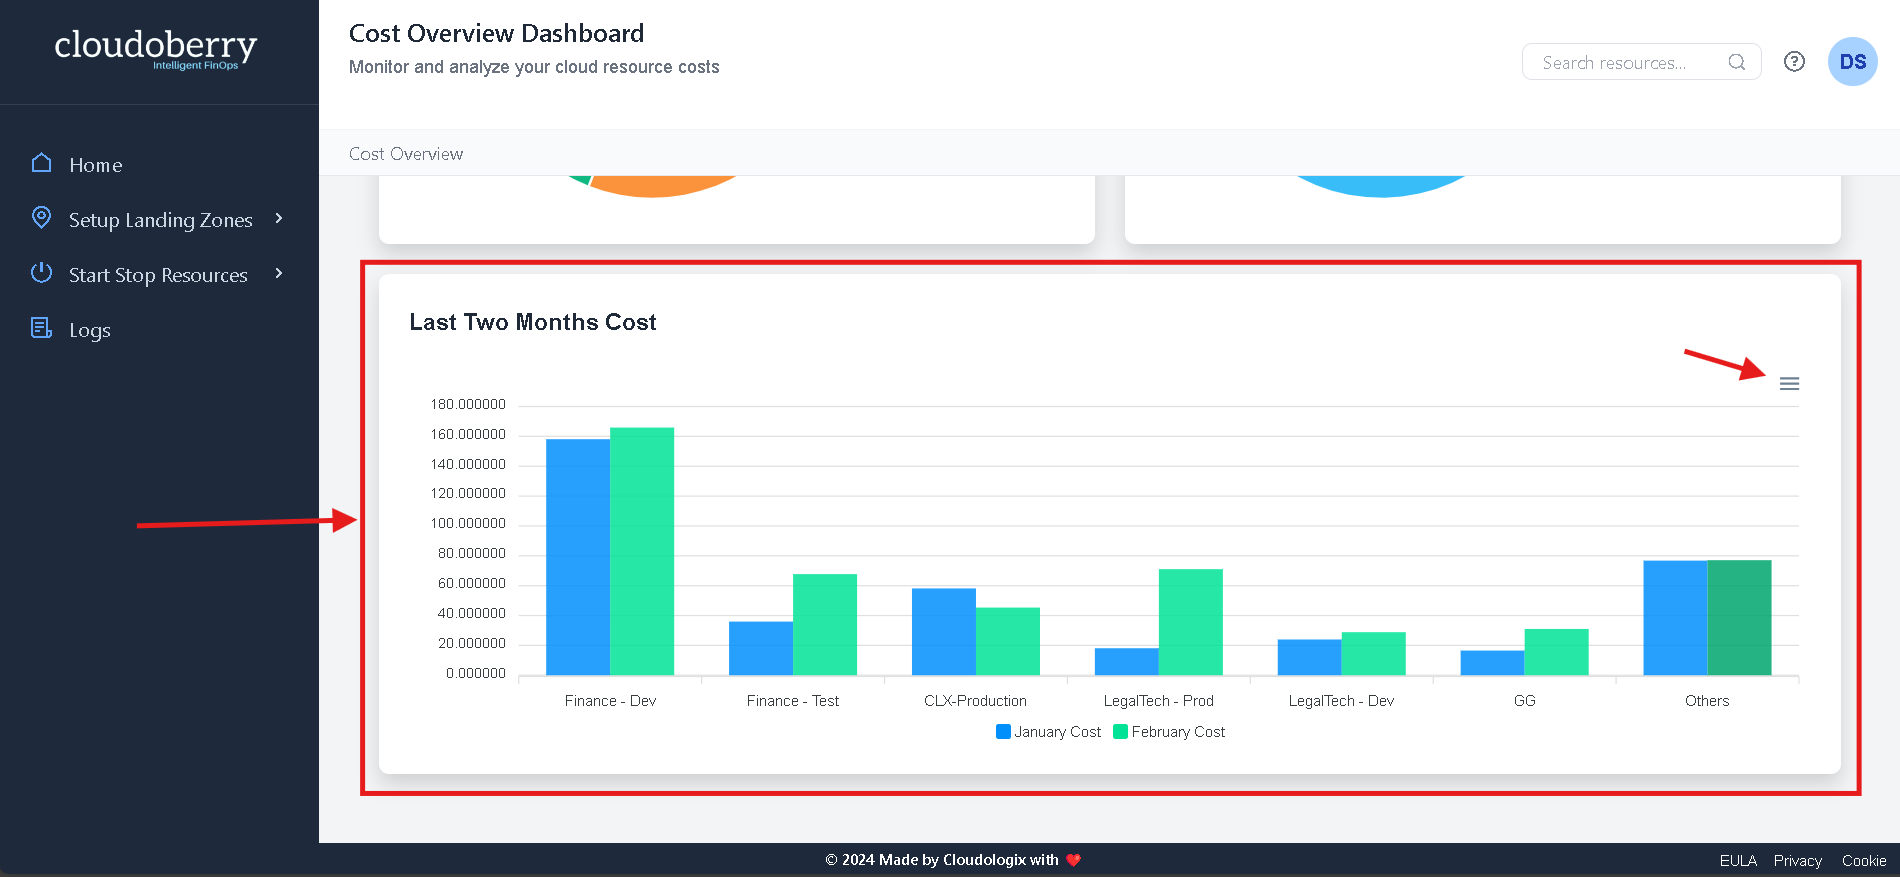
Clicking on the Hamburger Menu provides an option to download the cost data in various formats, including SVG, PNG, and CSV for easy sharing and analysis.